Introduction:
|
To start this project off we got a worksheet called "Distance, Velocity and Acceleration. For this worksheet we worked on finding distance, velocity and acceleration in graphs. We had to figure out what the graph was representing. We then did a paper called "Victory Celebration" where we had to use what we learned from the first worksheet to sketch and figure out the velocity, distance and acceleration. After that we moved on to parabolas. For these papers we had to find equations for the parabola and graph them using Desmos. On the next worksheet we focused on vertex form but specifically vertex from for parabolas. We found out that general equation for it is y= a(x-h)^2+k. A few of the worksheets had us try to completing squares to change an equation from vertex to standard form. We got one worksheet that was called "How Much Can They Drink" and it focused on volume, more specifically the volume of a drinking trough. When we were getting close to the end we did a packet where we focused more on Pythagorean theorem. We used the equation a^2+b^2=c^2. For this problem we had to find x, which in this case was a missing side to a triangle.
(Examples of work on the below) |
|
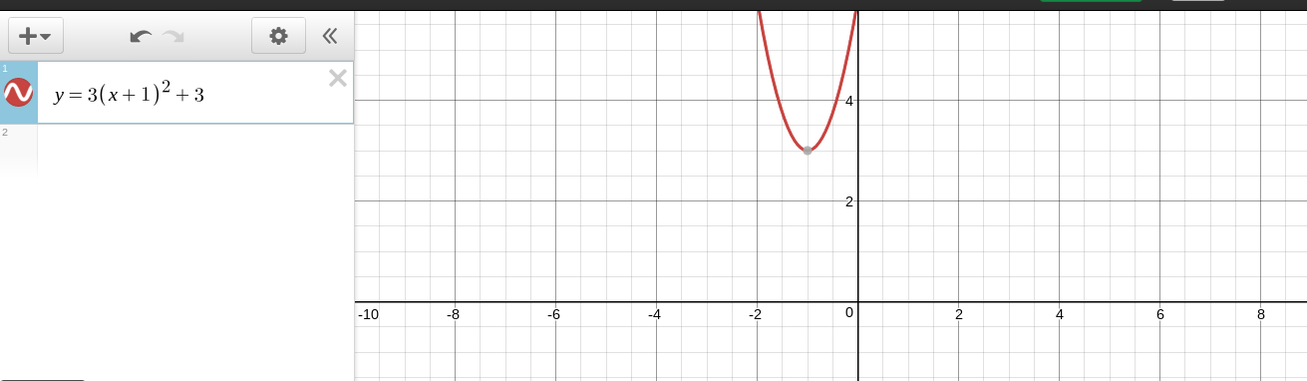
Exploring the Vertex Form of the Quadratic Equation:
During these series of handouts we used an online graphing site called Demos that helped us graph the equations and see what they would look like. While we were on this site we got to explore how a, h and k affect the equation y=a(x-h)^2+k. After a while we learned what h, k and a do. H is the x coordinate, a decides whether the parabola concave up or down(Negative means it conclaves down and positive it conclaves up) and it also its changes how wide or slim it is, k is the y coordinate. (Example of work down below)
Other Forms of the Quadratic Equation:
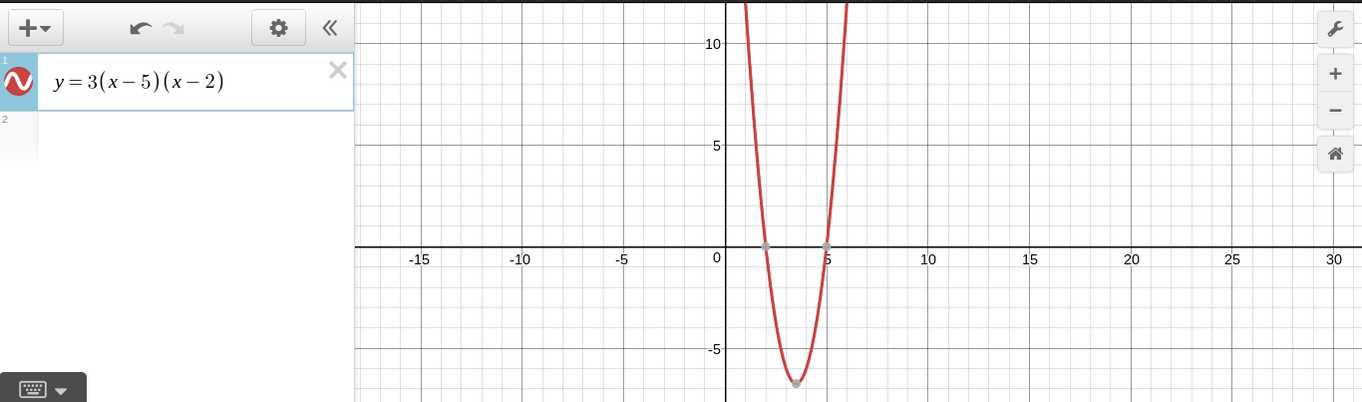
Standard form is ax^2 + bx + c = y. It is the most used form for the equation of a parabola. It is more organized than other equations and it also gives us the y-intercept value which is c. Factored form is a(x - f )(x - r) = y and it is useful because it gives us the x-intercepts. Example: If the equation was y =3(x-5)(x-2) then the x intercept coordinate must have a y value that is zero because if we rewrite it as 0=3(x-5)(x-2) then we know that the parenthesis have to equal zero so that the equation actually work, That being said x has to be 5 and 2. (Example of what this equation looks like on a graph below)
Converting between Forms:
|
We solved these problems by using equations and other things like and area model. An are model is a square that is divided equally into four sections and you use it to help you plug in your information. It is a good visual to have and it helps a lot.The slide show to the right shows step by step how to convert between vertex to standard, standard to vertex, factored to standard and standard to factored without an area model. The images below show me using an area model to help me go from vertex form to standard and standard form to vertex.
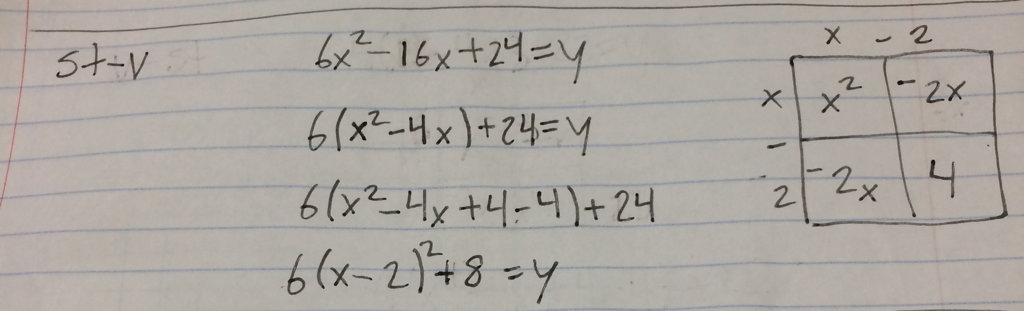
Above is an example of Standard form to Vertex form using and area model.
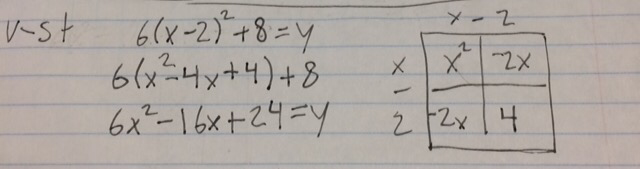
Above is an example of Vertex form to Standard form using an area model also.
|
|
Solving Problems with Quadratic Equation:
|
Kinematics: For kinematics we did a paper called "Another Rocket". For this problem we had to find out this rockets maximum height and we needed to find the coordinate point for where the rocket lands. We also had to find out how long it took the rocket to reach maximum height and how long did it take the rocket to hit the ground. (work in slideshow)
Geometry: For geometry we did this paper called "Emergency at Sea". In this problem we had to find out things such as setting up an equation that will tell us how far the boat is from tower A when it reaches the shore. (work in slideshow) Economics: For economics we did a paper called "Profiting from Widgets". We had to figure out the most widgets they could sell using an equation they gave us. We then had to make our own function that would include "d"(dollars). I ended up making a table graph to see what the maximum revenue would be. |
|
Reflection
During this whole project I learned a lot about quadratics. Even though we got a TON of papers for this project I did turn them in on time and kept them organized. I would have to say that my biggest takeaway from this is that team work and collaborating is essential. Me and my table members helped each other so much and I am very grateful for it. I think this project should not have been so as rushed as it was because we were doing like a paper a day and they started to pile. It was a little overwhelming because there was a lot of papers but that didn't stop me and my table from getting at least two papers done a day. I can easily say that I used each one of the Habits of a Mathematician because of how much their was to this project. Each one of them played a role in this project and was very important for me to use so I could succeed. My goal for 11th grade is to keep collaborating with my table members. I would like to continue to study for the SAT because I am not sure if I'm prepared quite yet. I will keep studying on khan academy and trying to get all of my assignments done on it for my SAT prep.
